
Blog
Adidas AG
- 2020-01-06
- Traiding Idea
Adidas AG and its subsidiaries design, develop, produce and market a range of athletic and sports lifestyle products. The Company's segments include Western Europe; North America; Greater China; Russia/CIS; Latin America; Japan; Middle East, South Korea, Southeast Asia/Pacific; TaylorMade-adidas Golf; Runtastic and Other centrally managed business. Each market includes wholesale, retail and e-commerce business activities relating to the distribution and sale of products of the adidas and Reebok brands to retail customers and end consumers. The Company has over 2,800 own-retail stores, over 12,000 mono-branded franchise stores, over 120,000 wholesale doors and over 50 e-commerce sites. adidas and Reebok branded products include footwear, apparel and hardware, such as bags and balls.
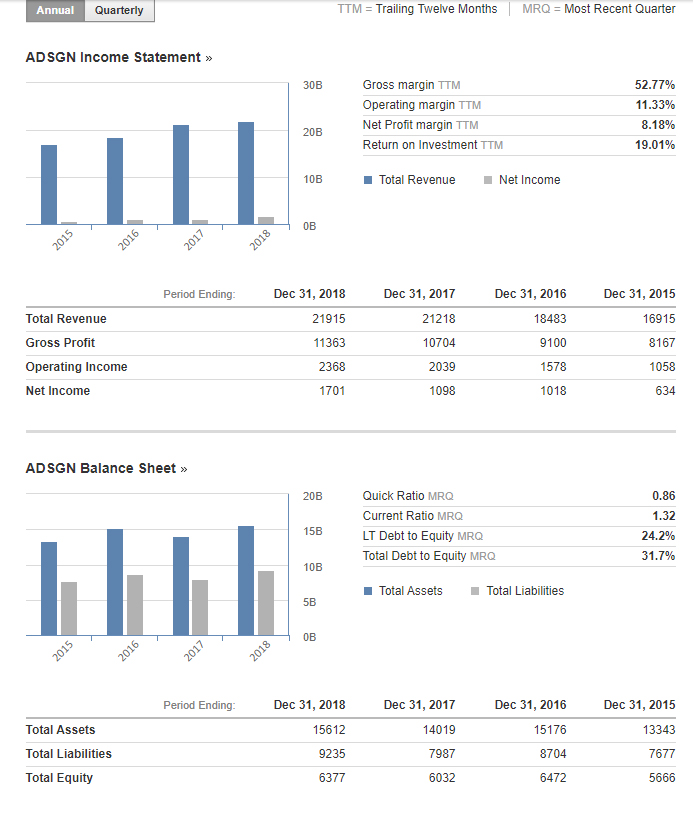
Financial Data:
For the six months ended 30 June 2019, adidas AG revenues increased 5% to EUR11.39B. Net income before extraordinary items increased 14% to EUR1.09B. Revenues reflect Asia Pacific (Region) segment increase of 12% to EUR4.01B, North America segment increase of 12% to EUR2.37B. Net income benefited from Royalty and commission income increase of 28% to EUR74M (income).
Technical Analysis:
First of all we have an upward trend for Adidas AG chart. the price was in Sniper position, so price was above exponential moving avererage 20 , 50, 100, 200, in all time frames daily, H4, H1, M30, M15 . The second Reason the price is from August 2019 in a Triangle Pattern and Compressed for an impulse movement. The price has been breaked the Top of the triangle and now is pulling back, for this position we would waiting for completting the Pull back Process and then we could be considered to open Long Position.

Trading tips:
To open long positions, may be open the position @ 285
TP1: 300 @ R1 Monthly
TP2: 310 @ R2 Monthly